One-sentence problem: Can a young adult’s financial and demographic profile predict whether they have health insurance — and can that prediction be turned into a tool for finding coverage gaps?
The question
Roughly 1 in 6 Gen Z adults are uninsured. If insurers, employers, and public programs could reliably identify who is most likely to fall through the cracks, they could direct limited outreach where it actually matters. So I built an end-to-end machine-learning pipeline on the FINRA Foundation’s National Financial Capability Study (NFCS) 2024 — 6,133 Gen Z respondents — to predict health-insurance status and, more importantly, to locate the coverage gap.
The pattern
Three findings stood out:
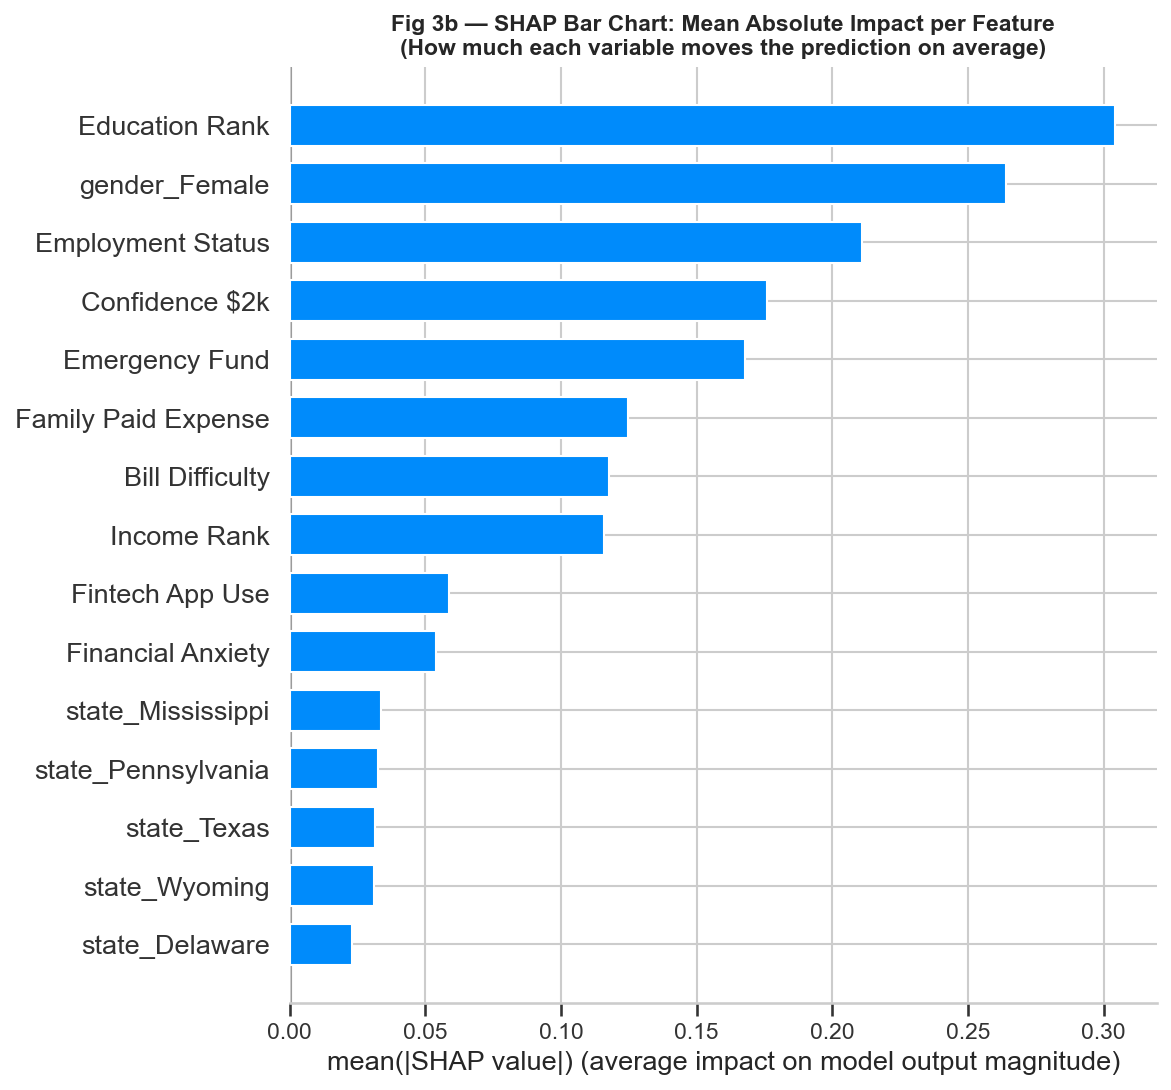
Education, not income, is the dominant predictor. This runs against the usual “income is king” intuition — for this early-career group, how far someone got in school separates the insured from the uninsured far more than what they earn.
A financial-fragility cluster marks the uninsured — no emergency fund, low confidence raising $2,000, trouble paying bills. These signals travel together.
The “accuracy paradox.” My Random Forest scored the highest accuracy (83%) — but caught only 7% of the uninsured. Because ~84% of the sample is insured, a model can look great by mostly guessing “insured” and still completely fail at the actual job.
The “accuracy paradox.” My Random Forest scored the highest accuracy (83%) — but caught only 7% of the uninsured. Because ~84% of the sample is insured, a model can look great by mostly guessing “insured” and still completely fail at the actual job.
 Education is the strongest predictor of insurance status — while income sits far down the list.
So what?
The whole point of the project is that accuracy was the wrong yardstick. For finding coverage gaps, what matters is catching the uninsured minority — so the right tools were XGBoost (best ROC-AUC) and a class-weighted Logistic Regression (69% recall on the uninsured), not the higher-“accuracy” model.
That reframes the model from a prediction toy into a diagnostic: score each young adult’s probability of being uninsured, rank them, and let stakeholders act — insurers timing outreach to young adults approaching the ACA “age-26” cutoff, employers improving enrollment defaults for entry-level workers, navigators focusing on the eligible-but-uninsured. Closing those gaps lowers uncompensated-care costs and stabilizes premiums; leaving them open pushes cost onto everyone else.
Because the strongest predictors (education, gender, geography) aren’t things you can change about a person, I built in a fairness guardrail: the scores are for outreach and enrollment only — never to deny or price coverage — with SHAP transparency so the targeting can be audited.
How I did it
Built in Python (pandas, scikit-learn, XGBoost, SHAP). The pipeline filters the 25,539-respondent survey down to Gen Z, encodes coded survey responses into features, runs EDA, then does a stratified 70/30 split before fitting any preprocessing — imputer and scaler fit on the training set only, to prevent data leakage and keep the out-of-sample estimate honest. Three models (Logistic Regression, Random Forest, XGBoost) are compared on the same split and interpreted against the metric that fits the business goal.
…compared on the same split and interpreted against the metric that fits the business goal.
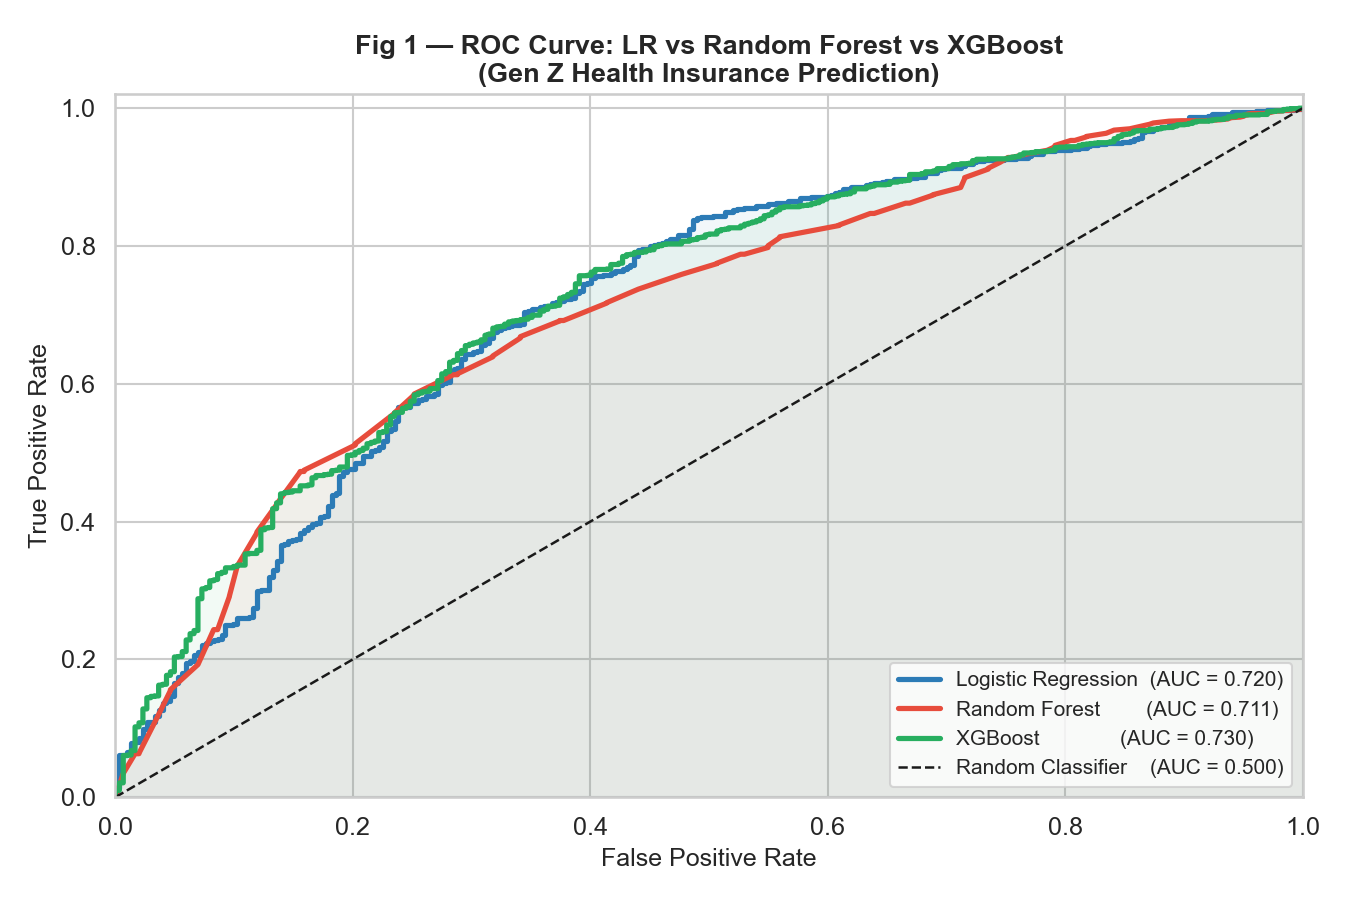 All three models compared by ROC-AUC. Random Forest’s high accuracy hides the lowest AUC — the accuracy paradox, visualized.
Dig deeper
Independent-study project, UMass Amherst. Data: FINRA Investor Education Foundation, National Financial Capability Study (2024).